I would like to know the consequence of adding 2 sinusoids of different frequencies. I assume that the result is not a pure sinusoid. I have tried a octave example and output plot is as below:

Hi. When you add two sinusoids of frequencies f1 and f2 you produce a third sinusoid whose frequency is (f1 + f2)/2. And that third sinusoid's peak amplitude is fluctuating. The algebra, and an example, of this behavior can be found at:
https://www.dsprelated.com/showarticle/189.php

Hi Rick
You don't really mean it in frequency domain[or in time domain]!
Rick, you are mixing addition of two sinusoids (the concern of the question) with multiplication (not of interest in the question). Addition does not produce any new frequency components.
[added later] Okay, I see now what you mean. I am using the term sinusoid literally which does not permit modulation or variations in the amplitude.
From a semantic stand point, I suppose it would be more correct to say that the addition of two sinusoids is mathematically equivalent to a third sinusoid whose amplitude is modulating, but I got what Rick was saying.
Hi dszabo. Or perhaps it would be more correct to say, "The addition of two sinusoids, having different frequencies, is
mathematically equivalent to a third sinusoid whose amplitude is
sinusoidally modulated."
I'm picking up what you're putting down.

Visual interpretation and understanding in time domain is difficult, but if you plot the fft, you will start seeing peaks at different frequencies.
Adding two sinusoids of different frequencies can never produce a sinusoid. Indeed, depending on the relative frequencies, the sum might not even be periodic.
Does that answer your question adequately?
To Sharan123: Your original signal plots are correct, but you added two sine waves (differing in frequency by one Hz) whose frequencies are low relative to the Fs sample rate. Try adding two higher-frequency (relative to the Fs sample rate) sine waves whose frequencies also differ by only one Hz.
I prefer to say:
"The addition of two sinusoids, having different frequencies generates a repeating pattern whose amplitude is sinusoidally modulated but is never a new sinusoid"
looks like the black sheep joke story
Sharan123, if you have MATLAB then try this code:
n = 0:128;
for K = -2:0.25:2;
x = 1*sin(2*pi*n*16/128) + 10^K*sin(2*pi*n*14/128);
figure(1), clf
plot(n/32,x,'-r',n/32,x,'ks','markersize', 2), grid on
xlabel('Time (Seconds)'), pause(), disp('HIT A KEY!')
end
After the first time through the loop, count the number of cycles in the first two seconds. And when the the code has completely finished, count the number of cycles in the first two seconds.
This the code listing with updated frequencies:
Fs = 100; % Sampling frequency
T = 1/Fs; % Sampling period
L1 = 100; % Length of signal
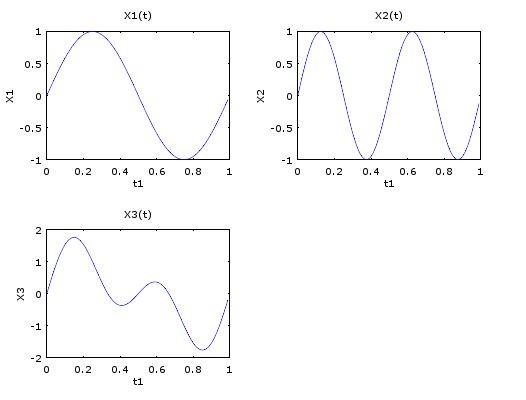
t1 = (0:L1-1)*T; % Time vectorX1 = sin(20*pi*t1);
X2 = sin(21*pi*t1);
X3 = X1 + X2;subplot(2,2,1)
plot(t1,X1)
title('X1(t)')
xlabel('t1')
ylabel('X1');subplot(2,2,2)
plot(t1,X2)
title('X2(t)')
xlabel('t1')
ylabel('X2');subplot(2,2,3)
plot(t1,X3)
title('X3(t)')
xlabel('t1')
ylabel('X3');
The following is the plot from the code above:
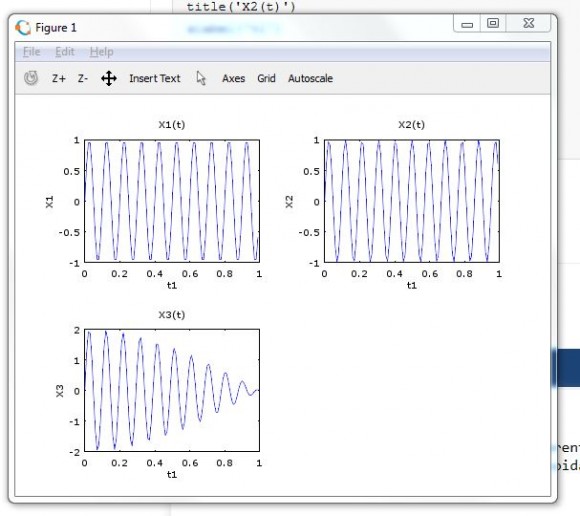
Hello Sharan123. You above post is messed up. Your plots' window seems to be covering up some part of your post. In any case, I suggest you set variable L1 to: L1 = 400 and rerun your code. Did you read the blog that I recommended to you in an earlier post of mine?
Hello Rick,
Actually, I have taken screenshot for the plots. So, some portion of my windows background is appearing. I will update the code for modified L value and run. I haven't read the blog you mentioned. I will do that. Thanks for your inputs
This is how the plot looks like:

The first is what is known as the "beat phenomenon". This is what Rick brought up. When two sinusoids of different frequencies are added together the result is another sinusoid modulated by a sinusoid. The math equation is actually clearer.
cos(A) + cos(B) = 2 * cos( (A+B)/2 ) * cos( (A-B)/2 )
The amplitudes have to be the same though. If they are different, the summation equation becomes a lot more complicated.
Your plots look correct.
sin(20*pi*t1) = sin(10*2*pi*t1); 10 cycles per frame
sin(21*pi*t1) = sin(10.5*2*pi*t1); 10.5 cycles per frame
The frequency of your envelope sinusoid is going to be (10.5-10)/2 = .25, which is why your third plot only has a quarter cycle of the envelope function.
The second special case is when the frequencies of the sinusiods you are adding are all harmonics of the same base frequency. This is what Fourier series are made of, and this is a core topic of DSP.
Ced

Hi Sharan123,
I thought I'd add one more thought to help you cement this concept. What Rick and Cedron have already said is the way to understand it mathematically and conceptually, so I'm merely going to add an example you can try. When sounds are played simultaneously their waveforms (the math) are added.
So, online, find sound generator (I like to play with audacity - it's free and open source), set the tone generator to 329 Hz, then hit the E just above middle C on your piano (or strum the E, top string, of your guitar), and listen very carefully. You'll hear the Wa Wa, or "beat" frequency riding on the sound of your two tones. That is the "sinusoidally modulated" 3rd frequency referred to by Rick, which will make the last pix you posted make even more sense.
Lacking a musical instrument, you could just set up two sounds on audacity, one set to 329 Hz and the other to 330 Hz.
Quickly, if you're interested http://www.audacityteam.org/. Play with making the difference very small, or larger. You'll get the picture quickly.